Bundle Browser
~~~ …this chapter is in development… ~~~
LASSO-CACTI Bundle Browser website: https://adc.arm.gov/lasso/#/cacti
The LASSO-CACTI Bundle Browser, located at https://adc.arm.gov/lasso/#/cacti, is a web-based application built specifically for helping users find and download files from LASSO-CACTI. The interface allows users to select individual parameters, such as case date, mesoscale or large-eddy simulations, simulation identifier, and more, in order to filter down to the simulations and particular files of interest. The application also provides an array of simulation and observation plots for guiding the user through the metadata selection process. Like the ARM Data Discovery application, the LASSO-CACTI Bundle Browser provides multiple data delivery options, including FTP, Globus, and THREDDS.

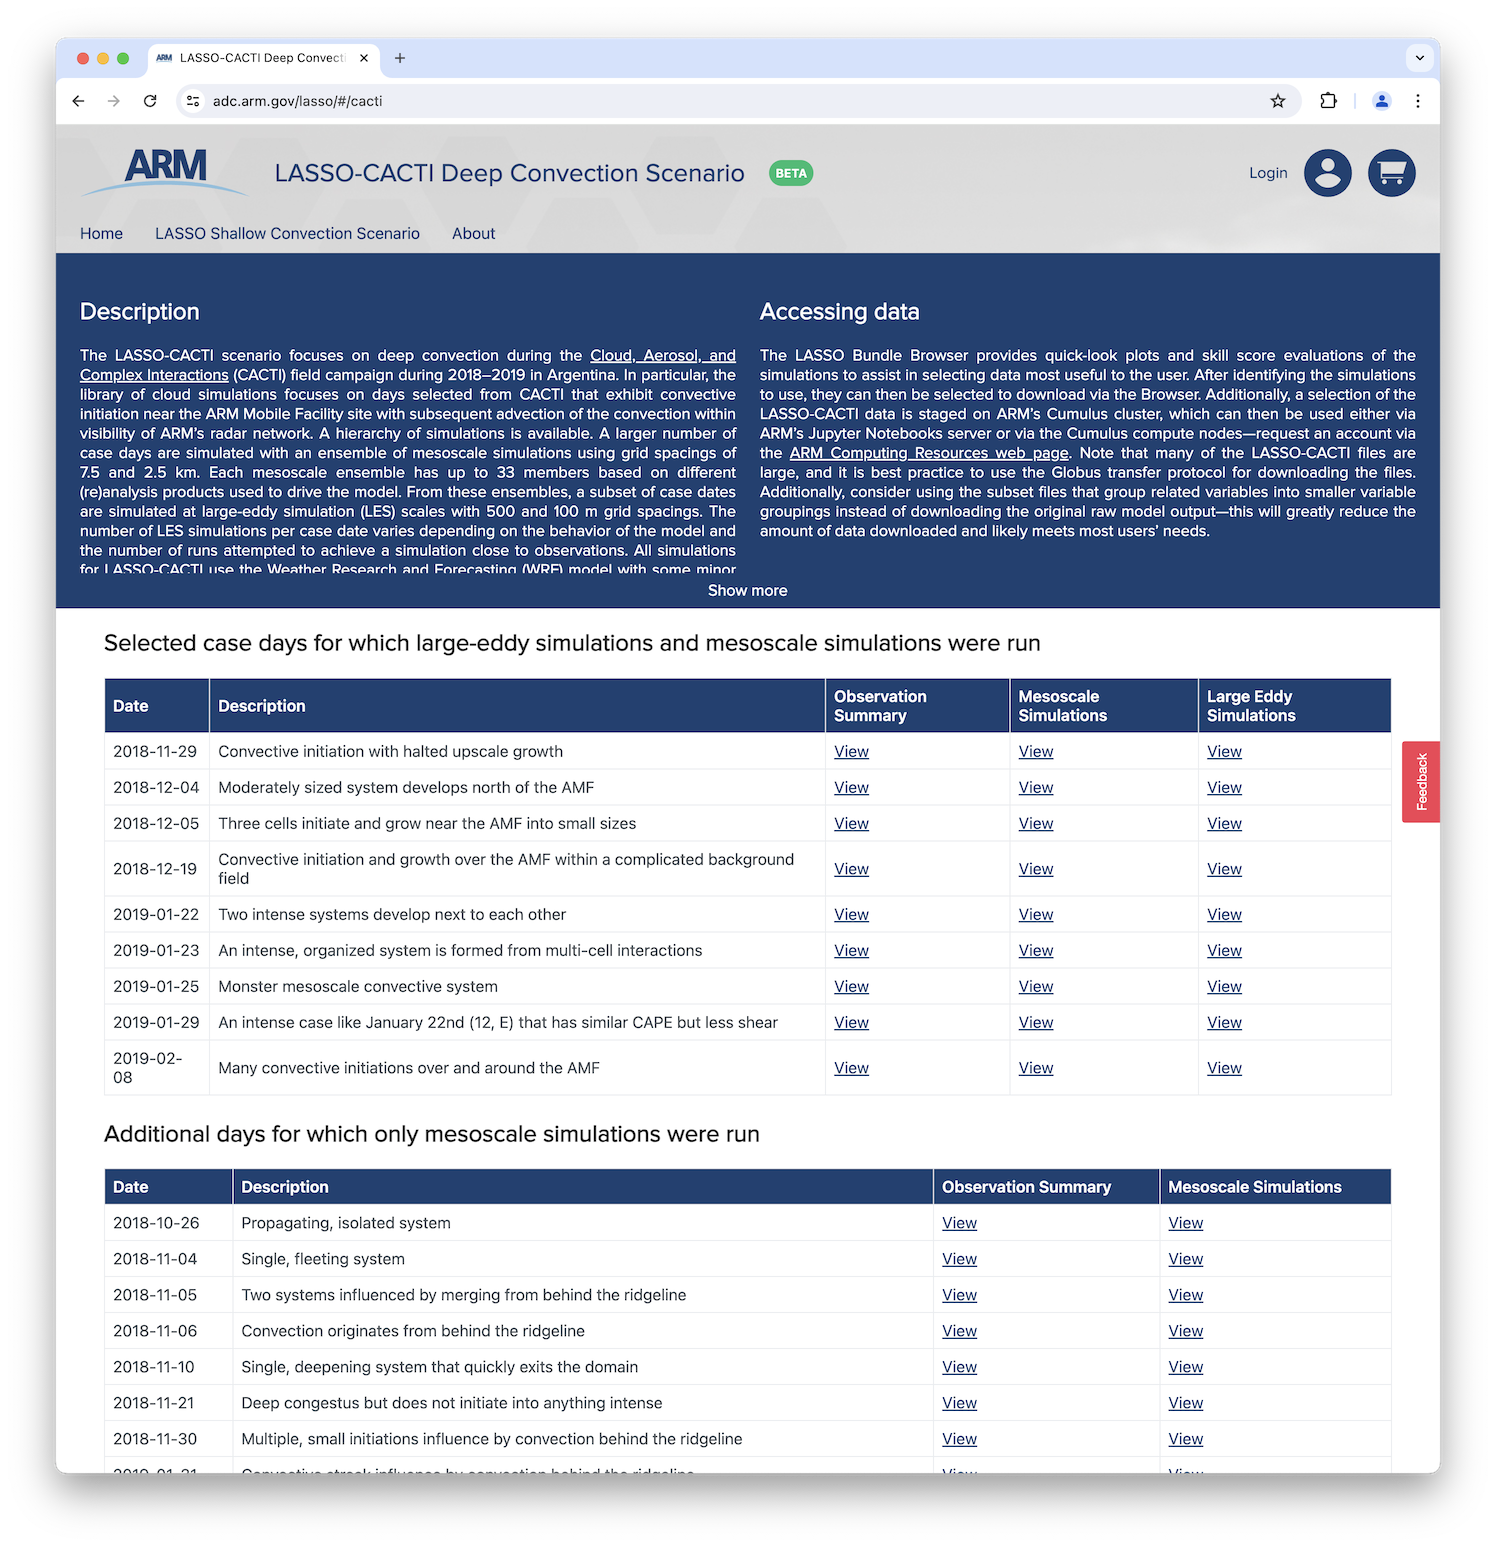
Figure 24 The LASSO-CACTI Bundle Browser Homepage.
The home page (Figure 24) displays a banner containing a description of LASSO-CACTI, an overview of how to access the data, and a list of related links. Below the banner are two tables of case dates, the first being the primary case dates for which LES and mesoscale simulations were run, and the second being the secondary dates for which only mesoscale simulations were run. Links within the tables bring users to pages containing observation summaries and model evaluation information at the mesoscale and LES scales for each case date.
Clicking a View link within the case date tables on the home page opens the respective page for that particular day. At the top of each case date page, the date and summary description are displayed, along with links to the corresponding “observation summary,” “mesoscale summary,” and (if applicable) “large-eddy simulations” pages (Figure 25). The user can utilize the minus and plus buttons beside the case date at the top of the page to navigate between available case dates.

Figure 25 Navigation header within the LASSO-CACTI Browser case date web pages.
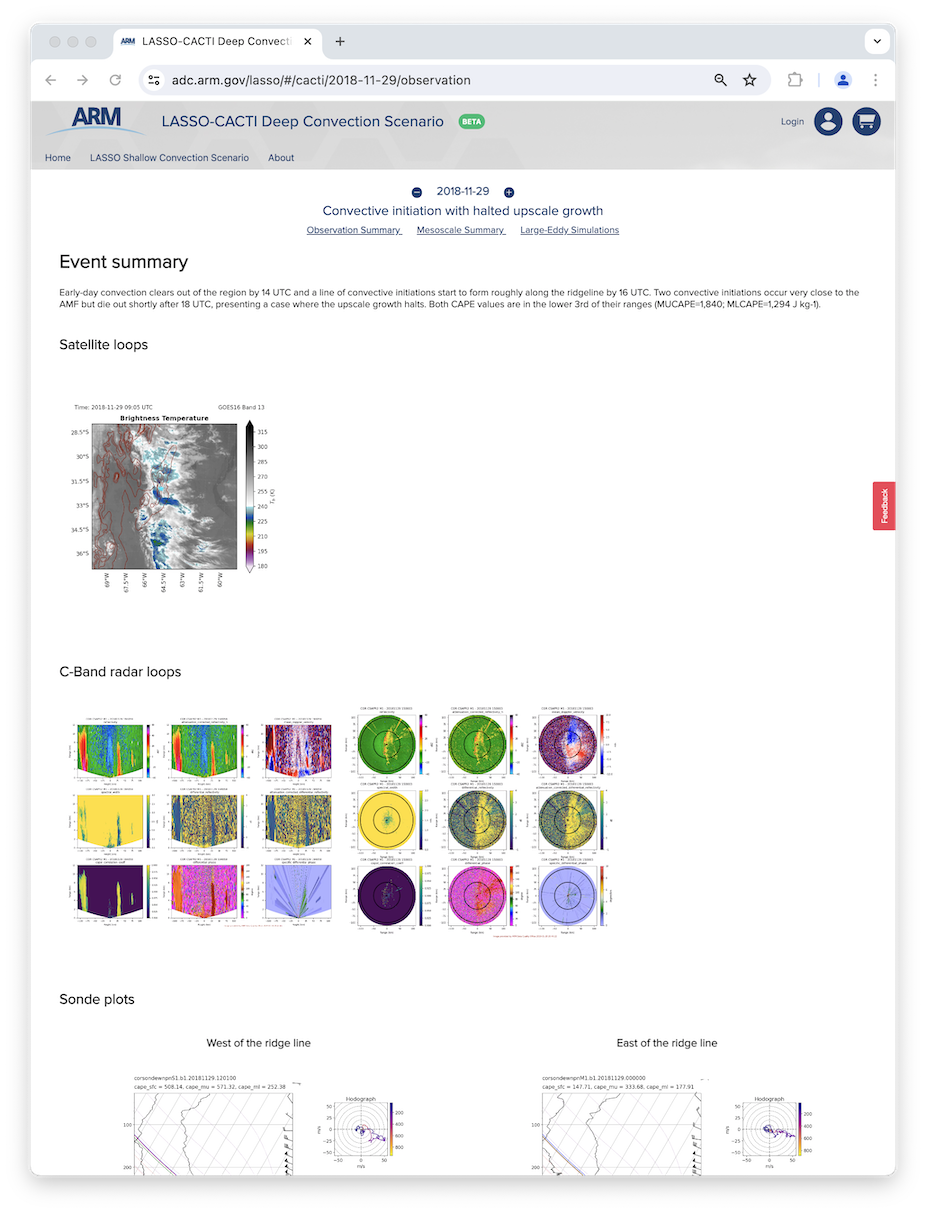
The “observation summary” pages, e.g., Figure 26, list the event summary, GOES satellite animations, C-Band radar animations (obtained from the ARM Data Center/DQ Office), and Skew-T plots. These plots, like all plots across the application, can be clicked to view an enlarged version. The Skew-T plots are arranged in columns such that plots from west of the ridge line are shown on the left-hand side (site S1), while the plots from east of the ridge line (site M1) are displayed on the right-hand side.

Figure 26 Observation Summary page from the LASSO-CACTI Bundle Browser.
The “mesoscale” and “LES summary” pages feature satellite-based convective region skill-score plots and radar-based echo-top height skill-score plots. Next to the plots, there is a Download CSV link that can be used to access the score data available for the simulations on the given case date. The bottom of the mesoscale summary page includes a table of simulation identifiers and configuration label pairs. The table displays net-skill scores for brightness temperature (Tb), echo-top-height, and precipitation that can be clicked to reveal plots for individual simulations. The right-hand columns contain links to access additional diagnostic plots for each simulation.
To order simulation files for download, users can click one or more rows of simulations, and then click Order Data at the bottom-right of the page. This will reveal a popup that allows refining the metadata selection for the specified simulation identifier and configuration label pair.
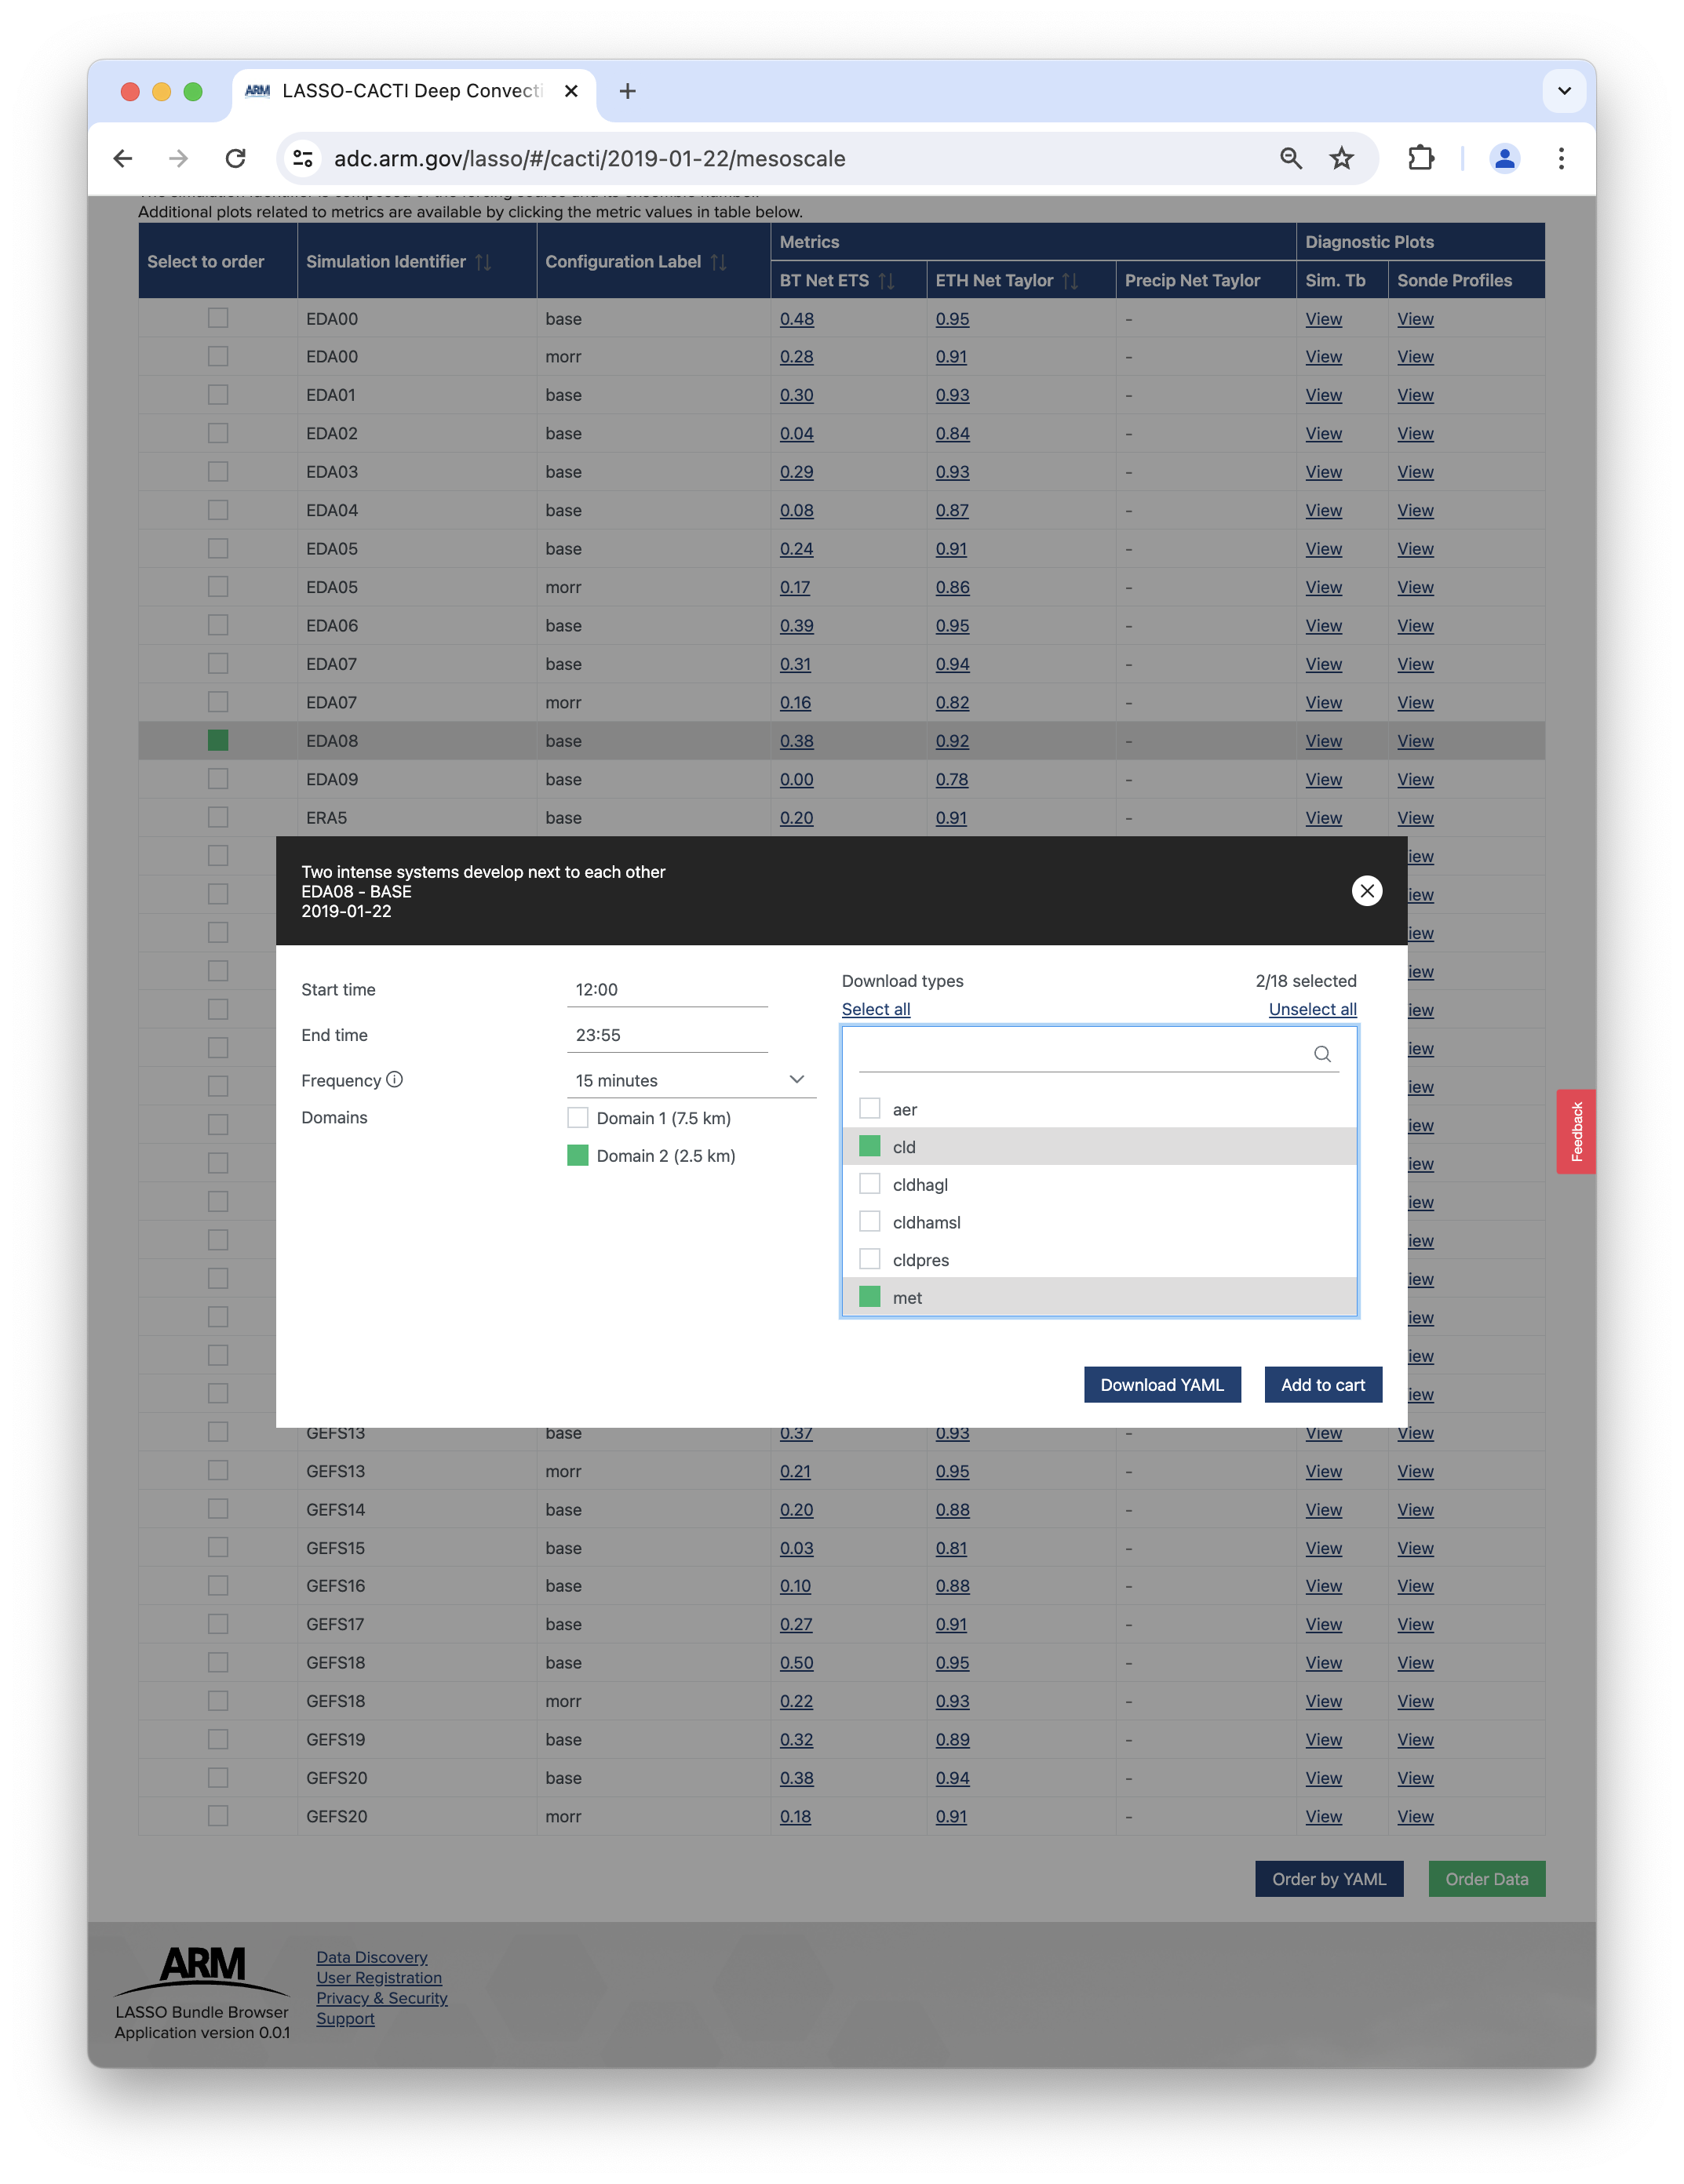
The resulting “ordering pop-up” (Figure 27) contains several fields used to narrow one’s request to the specific files of interest. The user has the ability to specify a start and end time within the selected case date, as well as the output frequency (interval of retrieved times). Individual domains may be selected as well (1 and 2 for mesoscale, 3 and 4 for LES). The specific file types to download are selected via the “Download types” box, which contains the raw WRF file types for input and output as well as the various groupings of subsetted variables as discussed in the Subsetted WRF Output section. Once these selections are made, the user has the option to apply these selections to other case days. Clicking Add to cart will place the selection(s) in the user’s cart and navigate them to the cart page.

Figure 27 Pop-up box for selecting file types to download for a case date.
As the name implies, the Cart Page displays all items the user has added to their cart, including all metadata selections made for those items. After reviewing their cart, the user can click Order to place an order, upon which a success pop-up is displayed containing their order number.
Note that users must log in with their ARM account to place the data order. If they do not already have an account, one can be requested by clicking Login at the top of the page, which displays a pop-up containing a link to Create an account.
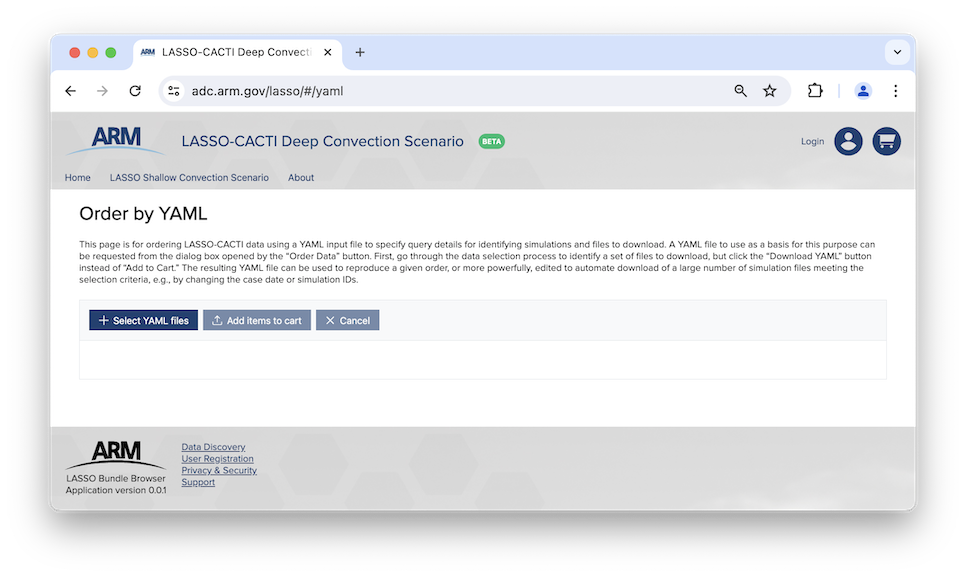
Users also have the ability to export their metadata selections in the form of a YAML file from the ordering pop-ups, as well as the cart page. This produces a YAML file for identifying the selected files, which can subsequently be uploaded via the Order by YAML page (Figure 28) accessed via the Order by YAML button near the bottom of the case pages. This permits users to build a basic query for an initial order, which can then be manually adjusted within the YAML file to apply to other simulations, dates, etc. This essentially is an API for autoamating the order process. By building scripts around this Order by YAML process, one can easily download selected simulations from the large number of available options.

Figure 28 Page to upload a YAML file to download LASSO-CACTI data files.
An example YAML file generated for the selections shown in Figure 27 is the following.
item-1:
  startTime: '2019-01-22T12:00:00.000Z'
  endTime: '2019-01-22T23:55:00.000Z'
  frequency: 15
  domainNumbers:
    - 2
  downloadTypes:
    - cld
    - met
  simulationIds:
    - eda08-base
If one wanted to download the same period and types of subset files, cld and met in this case, for a range of case dates, all one needs to do is alter the dates in the YAML, and submit the new YAML to the Order by YAML page again for each date. Note that multiple simulationIds, domain numbers, and downloadTypes can be listed in the same YAML file.