Background
The Large-Eddy Simulation (LES) Atmospheric Radiation Measurement (ARM) Symbiotic Simulation and Observation (LASSO) activity is designed to integrate ARM observations with modeling activities to enable more efficient research and to bridge scale gaps between observations and models. ARM’s approach is to organize LASSO around particular observation data sets and meteorological regimes, which are referred to as scenarios. The scenario concept provides users with a focused library of LES data tailored to specific types of clouds and atmospheric processes. Each scenario has been designed with general scientific applications in mind, but the scenarios are also broadly applicable to a wider range of uses. The first LASSO scenario focuses on shallow convection at ARM’s Southern Great Plains atmospheric observatory in Oklahoma [Gustafson et al., 2020, Gustafson et al., 2017, Gustafson et al., 2020]. The second scenario, the focus of this documentation, describes the LASSO scenario focusing on deep convection during the Cloud Aerosol and Complex Terrain Interactions (CACTI) field campaign, and thus this scenario is referred to as the LASSO-CACTI scenario.
The LASSO-CACTI Scenario
The LASSO-CACTI scenario targets deep convection during CACTI with a particular emphasis on convective initiation and upscale growth in the first hours of storm development. Convective clouds are subgrid-scale by nature in climate models and must be parameterized to account for their impact on the atmosphere. As such, they are an uncertain physical process that requires better understanding and handling in the large-scale models, such as the Exascale Energy Earth System Model (E3SM) developed by the U.S. Department of Energy. The current workhorse grid spacing for E3SM is 1 degree with high-resolution version 1 simulations available at ~25-km grid spacing. Future versions of E3SM will approach 2-km grid spacing, but even at these scales, many of the cloud processes are subgrid and parameterized.
Difficult aspects of studying convective clouds are their high level of variability and their dependence on the background meteorological state. Convective clouds can take very different forms and typically exist as part of a population of clouds with different heights and features. Subtle changes in the background can lead to very different cloud development. Threshold-based aspects of cloud formation, such as whether a lifted air parcel rises above the level of free convection or not, implies that the cloud formation is nonlinear. Slightly warmer or moister conditions could lead to divergent states in the overall cloud-system life cycle. Combine this with the inability to observe the full, three-dimensional environment around the cloud that defines the background state and one faces a difficult situation. These are some of the reasons why observations alone are insufficient to make large strides in advancing cloud understanding and parameterization in atmospheric models. Combining the observations with detailed, high-resolution models that encapsulate our best understanding of cloud processes is critical.
The LASSO-CACTI scenario is one approach to using modeling to supplement observations, and the overall design is such that it attempts to mitigate the two complicating aspects noted above. First, LASSO-CACTI consists of a series of simulations spread over many days to capture a range of conditions that lead to the clouds in the CACTI region. Second, the difficulty of knowing the background meteorological state is mitigated by using an ensemble approach for each case date. As described in more detail in the Case Selection section, a two-tiered modeling strategy starts with ensembles of 31 different boundary-condition data sets to drive mesoscale simulations with 2.5-km grid spacing. These are then examined to select a subset of one or more simulations for each case date to serve as the subsequent boundary conditions for LES simulations down to 100-m grid spacing. Both the full mesoscale ensembles and associated smaller number of LES simulations are available to researchers.
To best optimize use of available resources, the specific case dates chosen for simulating within LASSO-CACTI focus on convective initiation in the vicinity of the ARM Mobile Facility (AMF) deployed during CACTI. In so doing, researchers can combine the detailed modeling with the full suite of observations that range from basic surface meteorological stations to state-of-the-art scanning cloud and precipitation radars. Furthermore, the first several hours of the cloud life cycle is typically captured within the LES domain for many of the case dates.
The available simulations are applicable for a wide range of applications. Examples include using the ensembles of simulations to better understand implications of subtle differences in the background environment to subsequent cloud development, using the simulations to provide plausible connections between observations, looking at process rates within clouds and the boundary layer, examining simulated tracers flowing around and into the clouds, visualizing how the terrain impacts flow in the vicinity of the AMF, and looking at interactions between clouds and the environment. Besides using the simulations directly, researchers can access the simulation restart files to reproduce the existing results as well as extend them, for example, to add variables to the output, increase the output frequency, or change features of the configuration.
A new capability added to ease use of the LASSO-CACTI data set is direct access to high-performance resources alongside the ARM data. The total size of available LASSO-CACTI data is on the order of 1 petabyte, and thus is too large for most researchers to download. Two methods are available to researchers. The first is via a JupyterHub server, and for more complicated needs, via direct login to ARM’s Cumulus cluster. Details on accessing these resources are described in the ARM Computing section.
The CACTI Field Campaign
The suite of observations around which LASSO-CACTI is built comes from the CACTI field campaign held from October 2018 through April 2019 in the vicinity of Córdoba, Argentina [Varble et al., 2021]. Additionally, the National Science Foundation funded the Remote sensing of Electrification, Lightning, and Mesoscale/microscale Processes with Adaptive Ground Observations (RELAMPAGO) campaign, which aligned with CACTI and ran from June 2018 through April 2019 [Nesbitt et al., 2021]. Both campaigns deployed multiple cloud and precipitation radars, sounding sites, surface flux instrumentation, surface meteorology stations, and other complementary instrumentation. CACTI included an emphasis on aerosol measurements and was also the final deployment of ARM’s Gulfstream-159 (G-1) aircraft prior to its decommissioning. A more detailed description of the available observations is described in the Skill Scores and Observations section.
Understanding and simulation of deep convection has been a perennial issue for atmospheric scientists and is the focus of CACTI. Specifically, CACTI was designed around the following science questions [Varble et al., 2019].
How are the properties and life cycles of orographically generated cumulus humulis, mediocris, and congestus clouds affected by environmental kinematics, thermodynamics, aerosols, and surface properties? How do these cloud types alter these environmental conditions?
How do environmental kinematics, thermodynamics, and aerosols impact deep convective initiation, upscale growth, and mesoscale organization? How are soil moisture, surface fluxes, and aerosol properties altered by deep convective precipitation events and seasonal accumulation of precipitation?
The location of CACTI took advantage of the Sierras de Córdoba mountain range in central Argentina, which, in combination with the prevailing meteorology, commonly has development of large, severe cloud systems [Anabor et al., 2008]. The location of the AMF and other key sites are shown in Figure 1. The Sierras de Córdoba range is a long, straight ridgeline that extends north-south and lies to the west of the AMF site. The winds vary from day to day, with the prevailing winds being westerly in the mid-to-upper troposphere and easterly below the ridgeline for many of the case dates chosen for LASSO-CACTI. This leads to orographic lifting to trigger convection and the shear helps organize storms into mesoscale convective systems. The orography provides a predictable storm development region both for locating the instrumentation and for simplifying modeling because one can use a single domain configuration to simulate many of the CACTI days.
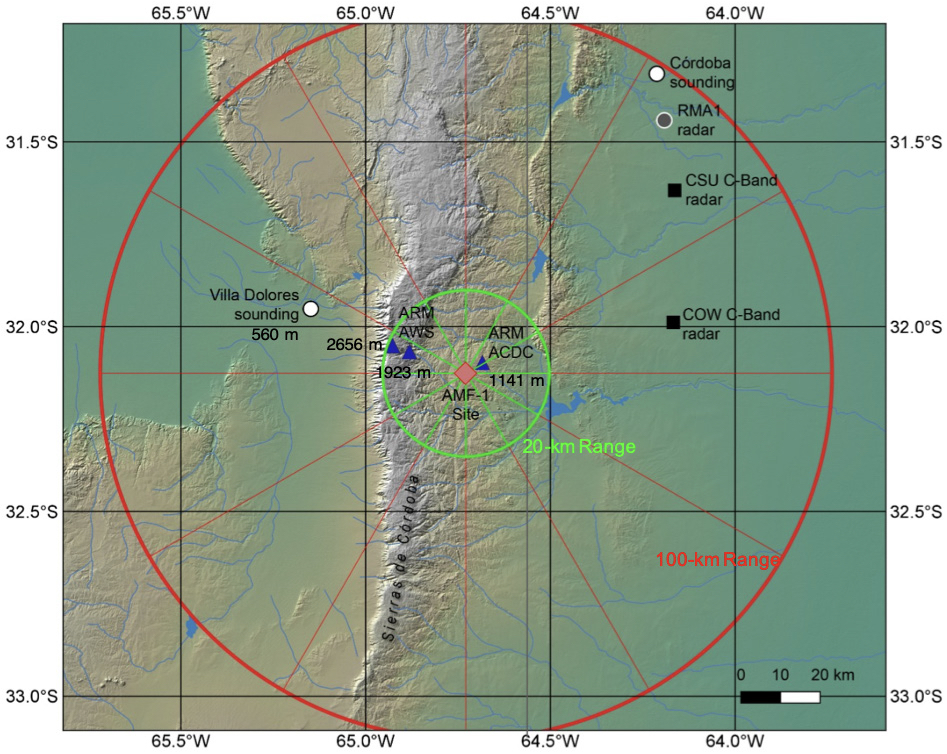
Figure 1 A map of the CACTI observing domain highlighting the Sierras de Córdoba mountain range, the AMF central site, nearby photogrammetric cameras (ACDC), upper-elevation meteorological stations, and the second ARM sounding site at Villa Dolores. The Argentinian operational RMA1 C-band radar and Córdoba sounding sites are shown along with the RELAMPAGO field campaign C-band radar locations (Figure and caption from Varble et al. [2019]).
More detailed information about CACTI can be found in the overview paper [Varble et al., 2021], the post-campaign report [Varble et al., 2019], and on ARM’s website at https://www.arm.gov/research/campaigns/amf2018cacti. Formally, CACTI serves as an umbrella project for a handful of related ARM-funded projects that contributed to the overall effort. Related projects include the CACTI Aerial Campaign, Supplemental Meteorological Stations for CACTI, and the Lightning Mapping Array Sensor for CACTI. Detailed information about RELAMPAGO can be found in its overview paper [Nesbitt et al., 2021] and on the RELAMPAGO website, https://www.eol.ucar.edu/field_projects/relampago.